Electron in Practice: Crash Reporting and Parsing
Preface
In Electron development, crash reporting is inevitable.
Electron provides crashReporter for reporting crashes.
https://www.electronjs.org/docs/latest/api/crash-reporter ,
The underlying crash handling uses crashpad. If interested, you can explore further.
https://chromium.googlesource.com/crashpad/crashpad/+/refs/heads/main/README.md
crashReporter
Start reporting via the start method.
start should be called as early as possible,
for example before app.on(‘ready’).
// crash reporter
const { crashReporter } = require('electron');

/**
 * start method
 */
crashReporter.start({
  // Server URL to submit to
  submitURL: 'https://your-domain.com/url-to-submit',

  // Product name
  productName: 'x',

  // Whether to compress. Default is true. If enabled, gzip is uploaded and the server needs to handle it
  compress: false,

  // Whether to rate limit. Default is false. If enabled, uploads once per hour
  rateLimit: false,

  // Whether to upload to server. Default is true. If disabled, crash files are only generated locally
  uploadToServer: true,

  // Whether to disable system crash handler. Default is false
  ignoreSystemCrashHandler: false,

  // Parameters to include. Parameters in extra are only included when the main process crashes
  extra: {
    userId: 'xxx',
  },

  // Parameters to include. Parameters in globalExtra are included for all process crashes
  globalExtra: {
    userId: 'xxx',
  },
});
Add parameters via addExtraParameter
crashReporter.addExtraParameter(key, value);Trigger a crash via the crash method for testing
process.crash();If child processes need to report separately, use the following method
process.crashReporter.start(options);Server-Side Crash Handling
Here we use the qiao-z framework for demonstration.
Documentation: https://qiao-z.vincentqiao.com/#/
Server: install dependencies
npm i qiao-z qiao-z-uploadServer: app.js
// qz
const qz = require('qiao-z');

// app
const app = qz({
  upload: require('qiao-z-upload'),
});

// listen
app.listen(9001);
Server: CrashController.js. qiao-z automatically scans files ending with Controller.js and registers routes.
// fs
const { renameSync } = require('fs');

// path
const { resolve } = require('path');

/**
 * crash controller
 */
module.exports = (app) => {
  // crash
  app.post('/crash', async (req, res) => {
    try {
      // fields
      const fields = req.body.fields;
      console.log('fields: ', fields);

      // file info
      const fileInfo = req.body.files.upload_file_minidump;
      const tmpPath = fileInfo.filepath;
      const destPath = resolve(__dirname, fileInfo.originalFilename);
      renameSync(tmpPath, destPath);

      // return
      res.send('crash success');
    } catch (e) {
      console.log(e);
      res.send('crash failed');
    }
  });
};
Server: start the service
node app.jsElectron: set the crashReporter submitURL
submitURL: 'http://localhost:9001/crash',Electron: trigger a crash 4 seconds after crashReporter starts
// report
crashReporter.start(options);

// crash
setTimeout(() => {
  process.crash();
}, 4000);
Server: check the results
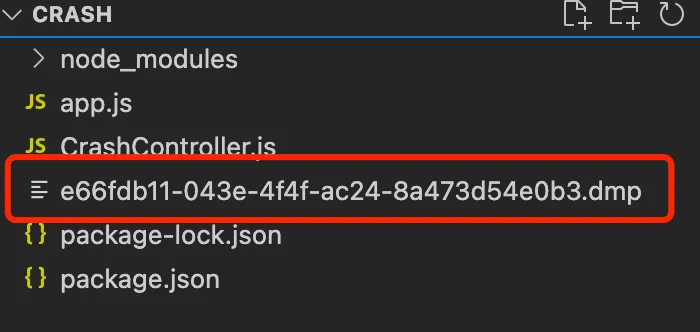
1.dmp file
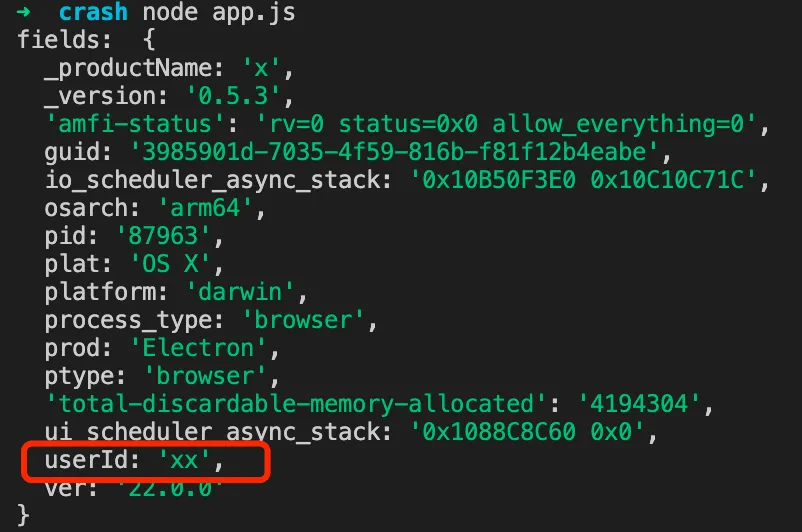
2.Reported information
Here you can see that in addition to basic information, the userId from globalExtra was also reported.
Parsing dmp Files
As shown above, we have obtained the dmp file from the Electron app crash.
So how do we parse dmp files? It is somewhat complex.
Install depot_tools
breakpad depends on depot_tools
|— First, clone the project
git clone https://chromium.googlesource.com/chromium/tools/depot_tools.git|— Then set the PATH
export PATH=/path/to/depot_tools:$PATHInstall breakpad
|— Create a directory
mkdir breakpad && cd breakpad|— Download breakpad
fetch breakpad
cd src
|— Build breakpad
./configure && make|— Install the commands
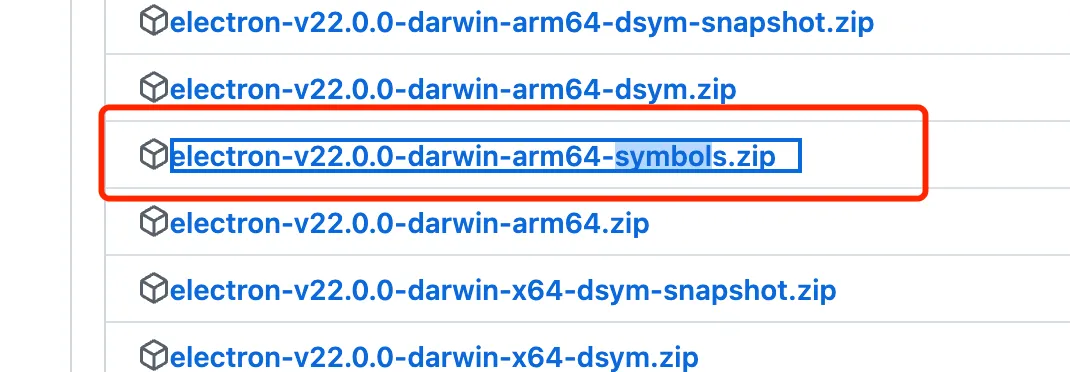
make installDownload Electron symbol files
|— Download URL: https://github.com/electron/electron/releases
|— Find the symbols.zip file matching your OS and Electron version and download it. For example, my local version is 22.0.0.
Parse dmp files with breakpad
|— Use breakpad’s minidump_stackwalk command to parse dmp files
minidump_stackwalk -s PATH_TO_DUMP PATH_TO_electron.breakpad.symThe two paths above:
The first is the dmp path, for example:
dmp/e66fdb11-043e-4f4f-ac24-8a473d54e0b3.dmpThe second is the sym path, for example:
electron-v22.0.0-darwin-arm64-symbols/breakpad_symbols/chrome_crashpad_handler/chrome_crashpad_handler.symThe parsed result looks like this
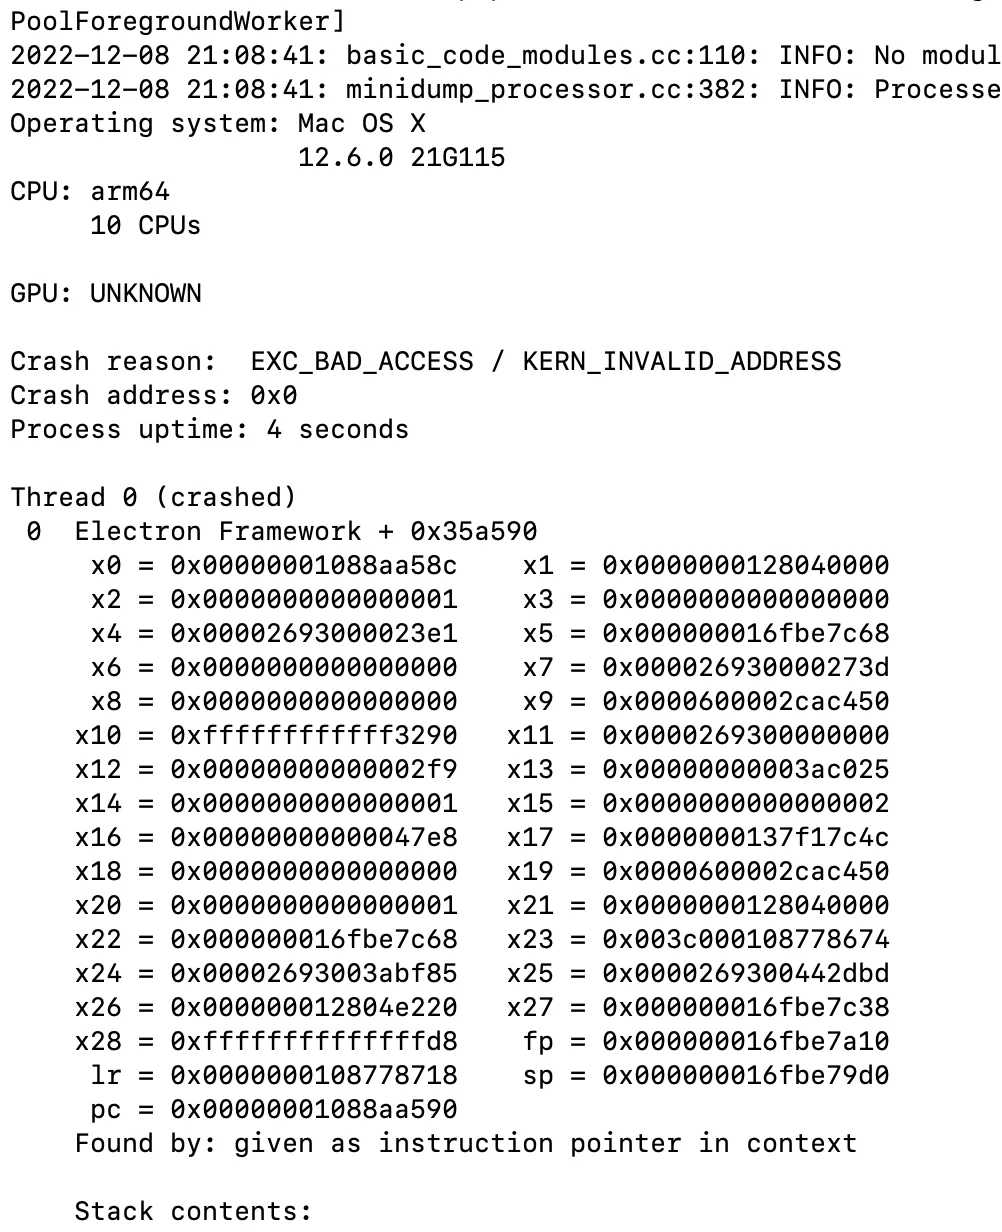
electron-minidump
The parsed file above has almost no readability.
This is because only the Chrome symbol file was used for parsing.
If you compare a dmp file to a bundled JS file,
to parse all the source code of the JS file,
you would need the source code of all npm packages it references.
Similarly, parsing a dmp file requires many symbol tables,
such as Electron’s, the Electron renderer process’s, Chrome’s, etc.
Here is a recommended tool for parsing: https://www.npmjs.com/package/electron-minidump
A brief summary of how this tool parses:
1.Download all the sym files needed for the dmp file
2.Use these sym files to parse the dmp file
Usage:
npx electron-minidump -f /path/to/your/dmp/fileThe result looks like this
Downloading sym files:

You can see that parsing a single dmp file
requires downloading 607 sym files.
The parsed content is as follows:
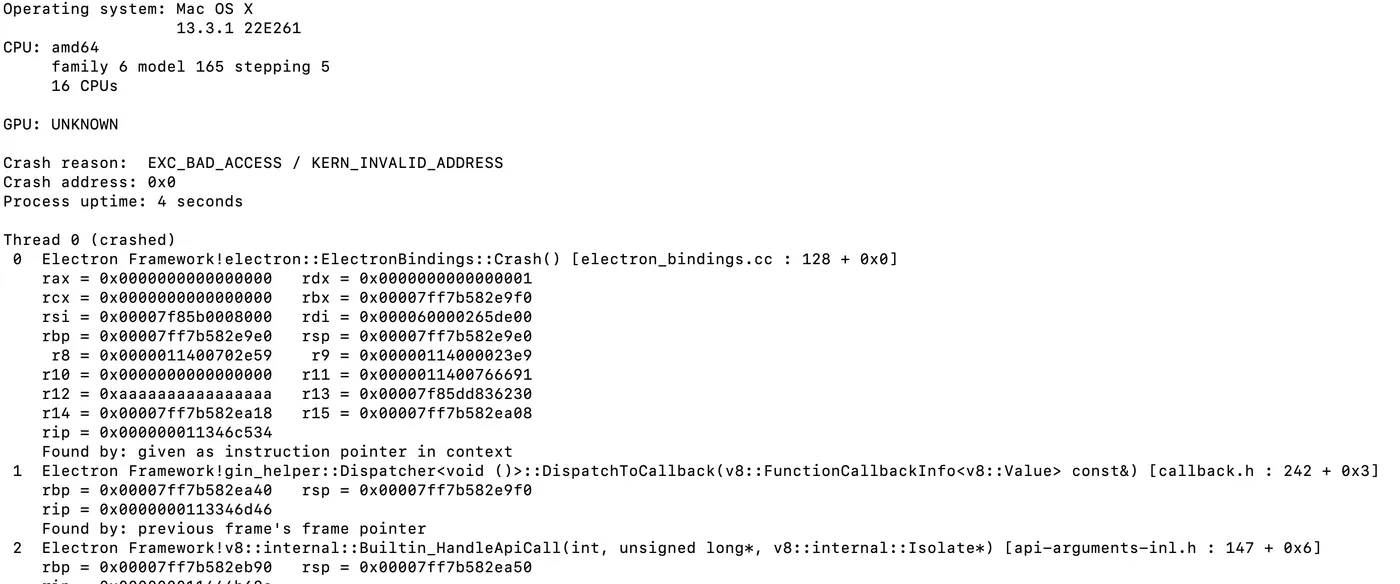
You can see that this time the parsed result shows the actual exception stack trace.
Third-Party Solutions
Parsing dmp files locally as described above is quite cumbersome.
Are there more convenient solutions?
Yes, but most of them are paid.
For example: https://sentry.io/welcome/
Summary
1. How to use Electron crashReporter
2. How the server receives crash reports
3. How to parse received dmp files locally
4. Alternative parsing solutions