prometheus+grafana
Preface
Prometheus + Grafana is the go-to choice for service monitoring and data dashboards.
Prometheus official site: https://prometheus.io/
Grafana official site: https://grafana.com/
A recommended Chinese tutorial: https://prometheus.wang/
This article is a summary with corrections for the latest version usage.
Prometheus
Prometheus is used to monitor various services.
Docker installation is recommended for simplicity.
Config File
First, you need a config file with the following content.
Save it as prometheus.yml
and place it on the server where you want to run Prometheus.
# my global config
global:
  scrape_interval:     15s # Set the scrape interval to every 15 seconds. Default is every 1 minute.
  evaluation_interval: 15s # Evaluate rules every 15 seconds. The default is every 1 minute.
  # scrape_timeout is set to the global default (10s).

# Alertmanager configuration
alerting:
  alertmanagers:
  - static_configs:
    - targets:
      # - alertmanager:9093

# Load rules once and periodically evaluate them according to the global 'evaluation_interval'.
rule_files:
  # - "first_rules.yml"
  # - "second_rules.yml"

# A scrape configuration containing exactly one endpoint to scrape:
# Here it's Prometheus itself.
scrape_configs:
  # The job name is added as a label `job=<job_name>` to any timeseries scraped from this config.
  - job_name: 'prometheus'
    static_configs:
    - targets: ['10.0.8.7:9090']
Docker Startup
The Docker startup script is as follows.
The last line (Docker image URL) can be replaced with your own private registry.
docker run -d -p 9090:9090 \
        --cpus="2" --memory="2g" --restart="always" --name="prometheus" \
        -v /home/ubuntu/data/prometheus/prometheus.yml:/etc/prometheus/prometheus.yml \
        prom/prometheus
UI
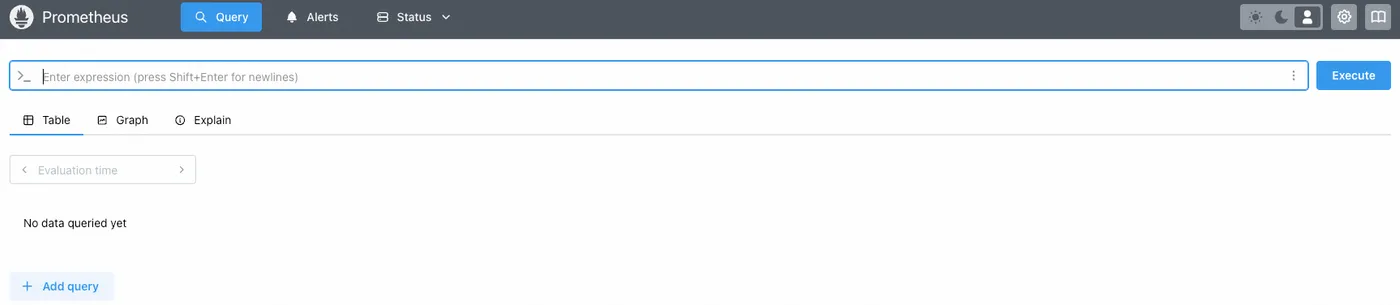
After startup, you can access it via port 9090. The UI looks like this:
Prometheus’s built-in UI is similar to ELK — you can also write your own QL queries.
prometheus-exporter
The Prometheus installed above is the server side, responsible only for collecting and processing data.
If you want to monitor a specific server’s status,
you need to start an exporter on that server.
Similarly, if you want to monitor MySQL, you need a MySQL exporter.
Here we start a node-exporter for server monitoring.
Docker Startup
Docker startup is also recommended. The command is as follows:
docker run -d \
  --net="host" \
  --pid="host" \
  --mount type=bind,source=/,destination=/host,readonly \
  --cpus="2" --memory="2g" --restart="always" --name="prometheus-node-exporter" \
  quay.io/prometheus/node-exporter:latest \
  --path.rootfs=/host
Add Configuration
After startup, add the following to the Prometheus config file.
Note: add the addresses of the servers you want to monitor in the targets field.
The addresses can be internal, as long as the Prometheus server can reach them,
or they can be publicly accessible.
  - job_name: 'node_exporter'
    scrape_interval: 15s
    static_configs:
      - targets: ['localhost:9100']
Grafana
Once the Prometheus server and node-exporter are configured,
you can query data through the Prometheus server UI using QL.
But writing QL is cumbersome,
so Grafana is typically used alongside it.
Docker Startup
Docker startup is also recommended. The command is as follows:
docker run -d -p 3000:3000 \
         --cpus="2" --memory="2g" --restart="always" --name="grafana" \
         -v /home/ubuntu/data/prometheus/grafana/config/grafana.ini:/etc/grafana/grafana.ini \
         -v /home/ubuntu/data/prometheus/grafana/data:/var/lib/grafana \
         grafana/grafana
The data folder is used to persist Grafana’s data,
preventing configuration loss when Docker restarts.
grafana.ini is the corresponding config file.
Login
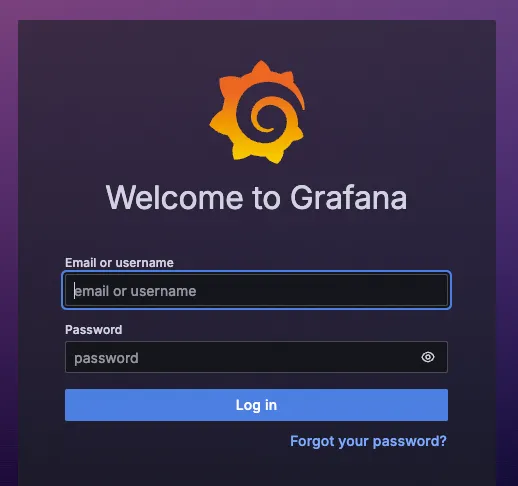
After startup, access it via port 3000.
Log in with admin/admin.
Configure Data Source
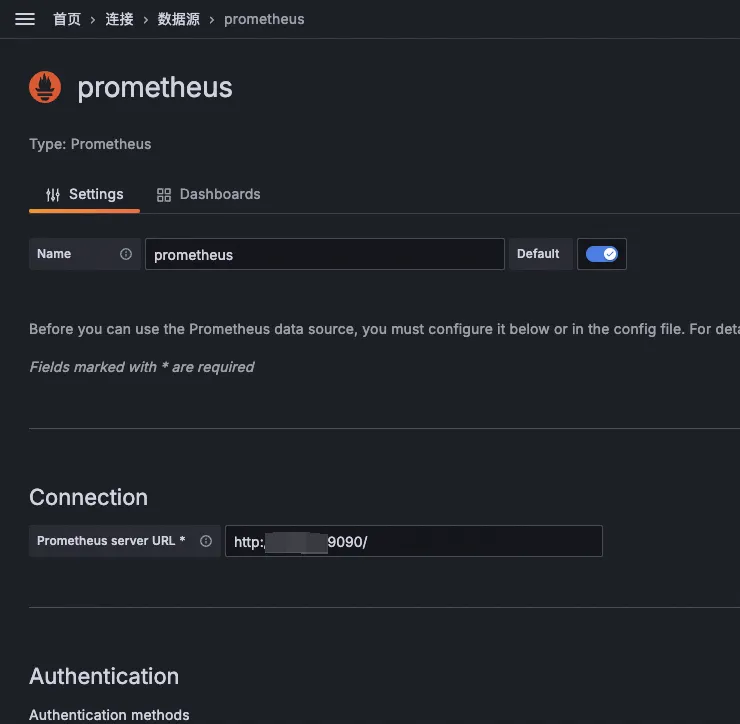
After logging in, configure Prometheus as a data source.
The configuration is simple — just set the Prometheus access URL on port 9090.
Create Dashboard
You can create Grafana dashboards manually,
but that’s also cumbersome.
Fortunately, Grafana offers a dashboard library
that you can use conveniently.
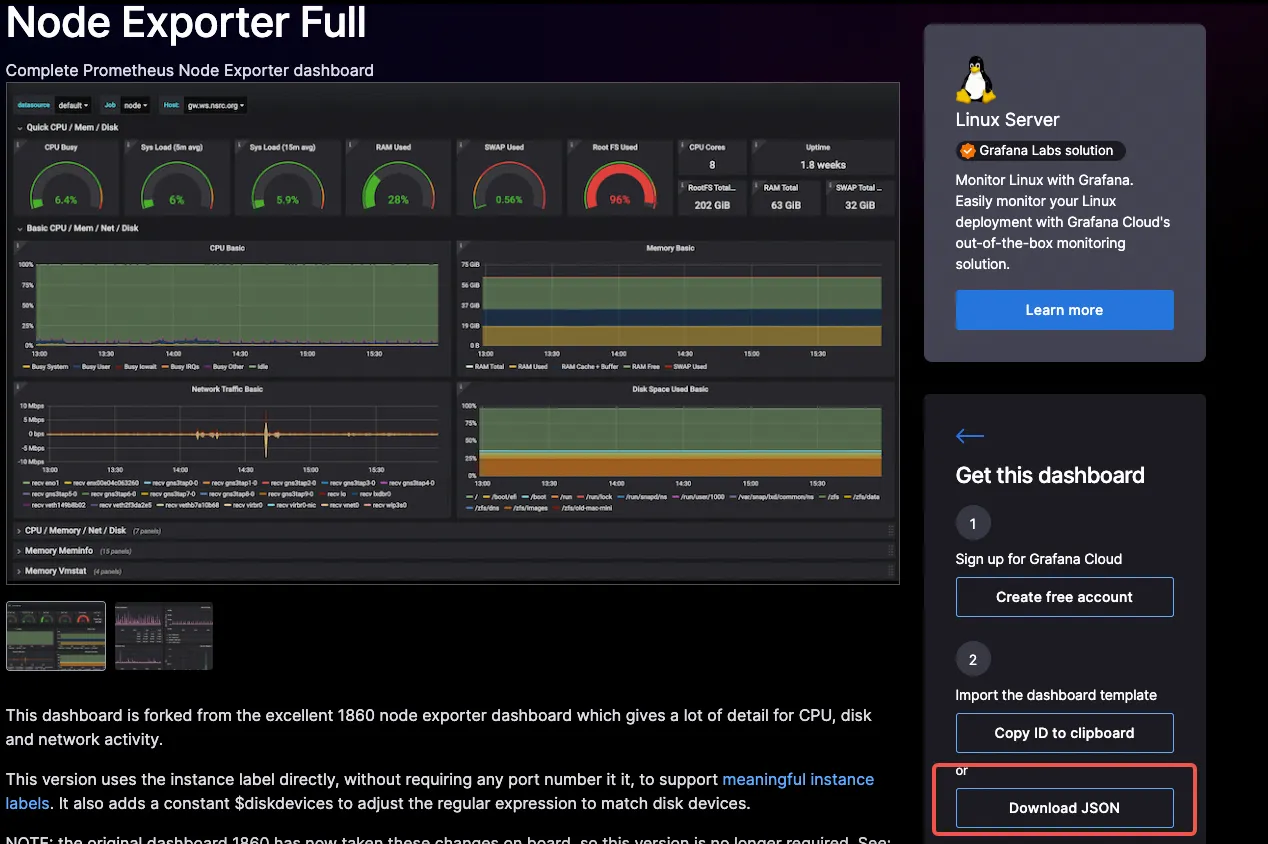
For example, there are many dashboards for node-exporter server monitoring.
URL: https://grafana.com/grafana/dashboards/?search=prometheus+node+exporter
Select a dashboard and download the JSON.
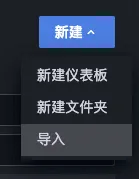
Import Dashboard
Then import the JSON into your Grafana.
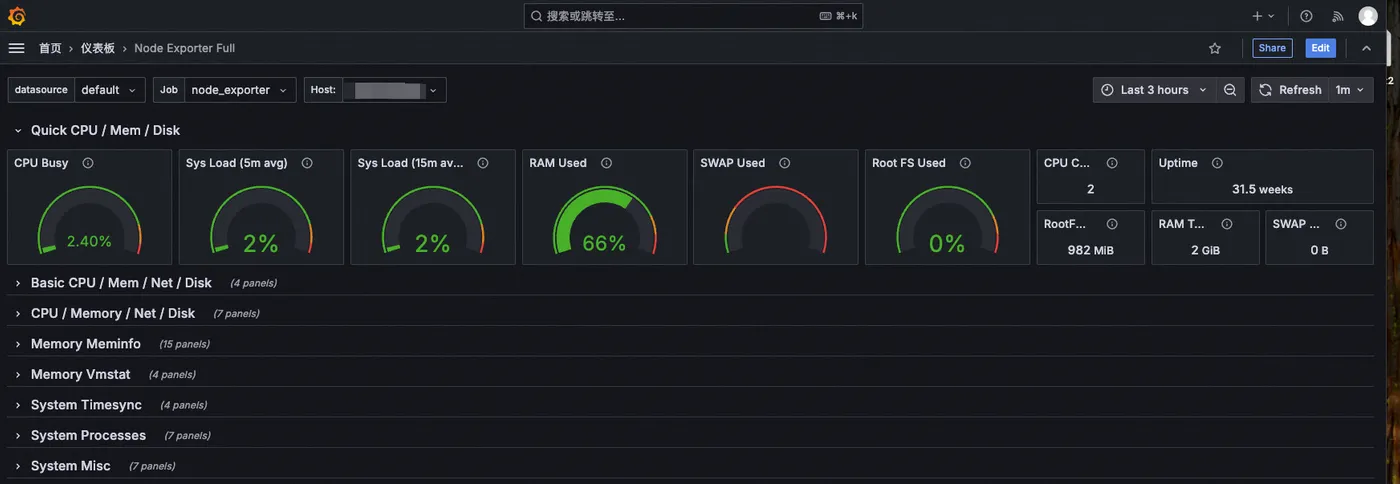
With Prometheus server collecting and processing data,
node-exporter reporting data,
and Grafana visualizing it — the dashboard is ready.
Summary
1. Use Docker to quickly start the Prometheus server, accessible via port 9090
2. Use Docker to quickly start node-exporter to report server status
3. Add the node-exporter address to the prometheus.yml config file
4. Use Docker to quickly start Grafana, accessible via port 3000
5. Configure the Prometheus 9090 address as a Grafana data source
6. Add a prometheus-node-exporter dashboard in Grafana
7. Prometheus server and Grafana should ideally be accessible on the internal network, or on the same server
8. The node-exporter address just needs to be reachable by Prometheus, whether internal or public
9. Only Grafana needs to be exposed externally