prometheus+grafana
【前言】
prometheus+grafana是目前服务监控,数据看板的不二选择。
prometheus官网: https://prometheus.io/
grafana官网: https://grafana.com/
推荐一个比较好的中文教程: https://prometheus.wang/
本文只是总结加修正最新版本使用方法
【prometheus】
prometheus是用来监控各种服务的
推荐docker安装,比较简单
配置文件
首先需要一个配置文件,内容如下,
可以保存为prometheus.yml,
放到需要启动prometheus的服务器上
# my global config
global:
  scrape_interval:     15s # Set the scrape interval to every 15 seconds. Default is every 1 minute.
  evaluation_interval: 15s # Evaluate rules every 15 seconds. The default is every 1 minute.
  # scrape_timeout is set to the global default (10s).

# Alertmanager configuration
alerting:
  alertmanagers:
  - static_configs:
    - targets:
      # - alertmanager:9093

# Load rules once and periodically evaluate them according to the global 'evaluation_interval'.
rule_files:
  # - "first_rules.yml"
  # - "second_rules.yml"

# A scrape configuration containing exactly one endpoint to scrape:
# Here it's Prometheus itself.
scrape_configs:
  # The job name is added as a label `job=<job_name>` to any timeseries scraped from this config.
  - job_name: 'prometheus'
    static_configs:
    - targets: ['10.0.8.7:9090']
Docker启动
docker启动脚本如下
最后一行docker镜像地址可以换为自己私有库的地址
docker run -d -p 9090:9090 \
        --cpus="2" --memory="2g" --restart="always" --name="prometheus" \
        -v /home/ubuntu/data/prometheus/prometheus.yml:/etc/prometheus/prometheus.yml \
        prom/prometheus
界面
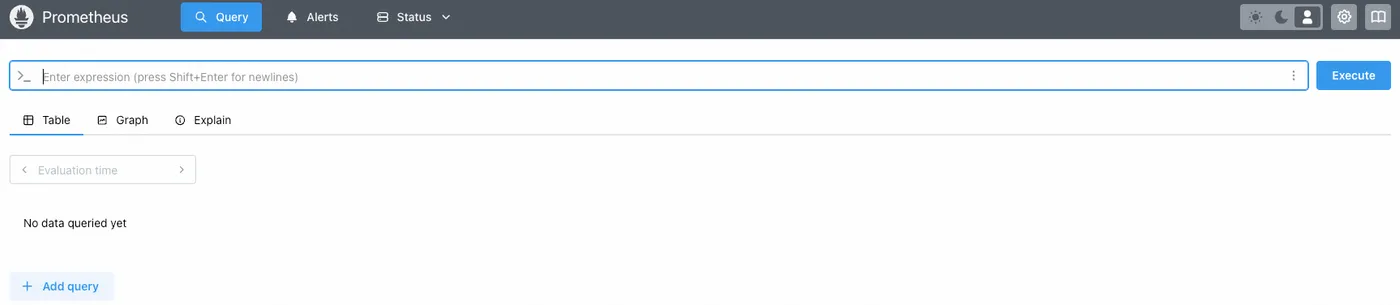
启动后可以通过9090端口访问到了,界面如下
prometheus自带的界面和elk的使用类似,也可以自己写QL查询
【prometheus-exporter】
上面安装的prometheus是服务端,只负责收集和处理数据,
如果现在要监听某一个服务器的状态,
那么需要再这个服务器上启动一个exporter,
同样的如果要监听mysql,那就需要一个mysql的exporter,
这里启动一个node-exporter,也就是服务器监听
Docker启动
也是推荐docker启动,内容如下
docker run -d \
  --net="host" \
  --pid="host" \
  --mount type=bind,source=/,destination=/host,readonly \
  --cpus="2" --memory="2g" --restart="always" --name="prometheus-node-exporter" \
  quay.io/prometheus/node-exporter:latest \
  --path.rootfs=/host
添加配置
启动后需要在Prometheus的配置文件添加如下内容
这里注意要监听那些服务器,就在targets中添加那些服务器的地址,
地址可以是内网,但是要Prometheus的服务器可以访问到,
或者就是公网可访问到
  - job_name: 'node_exporter'
    scrape_interval: 15s
    static_configs:
      - targets: ['localhost:9100']
【grafana】
当上面的prometheus-server和node-exporter配置好后,
就可以在prometheus-server的ui界面通过QL查询了,
但是写QL比较麻烦,
一般会配套grafana使用,
Docker启动
同样推荐Docker启动,内容如下
docker run -d -p 3000:3000 \
         --cpus="2" --memory="2g" --restart="always" --name="grafana" \
         -v /home/ubuntu/data/prometheus/grafana/config/grafana.ini:/etc/grafana/grafana.ini \
         -v /home/ubuntu/data/prometheus/grafana/data:/var/lib/grafana \
         grafana/grafana
其中data文件夹用来保存grafana的数据,
避免重启docker后之前的配置都消失
grafana.ini是对应的配置文件
登录
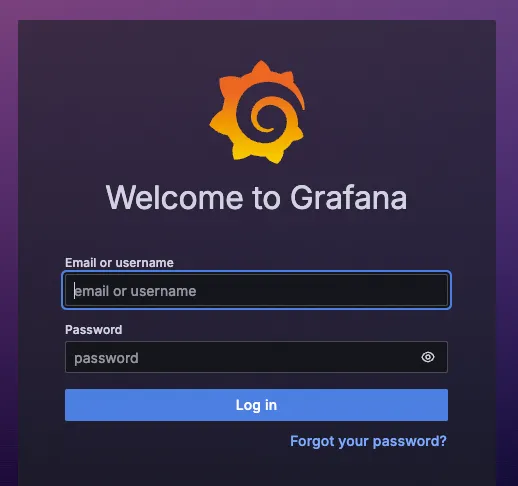
启动后通过3030端口即可访问,
使用admin/admin登录
配置数据源
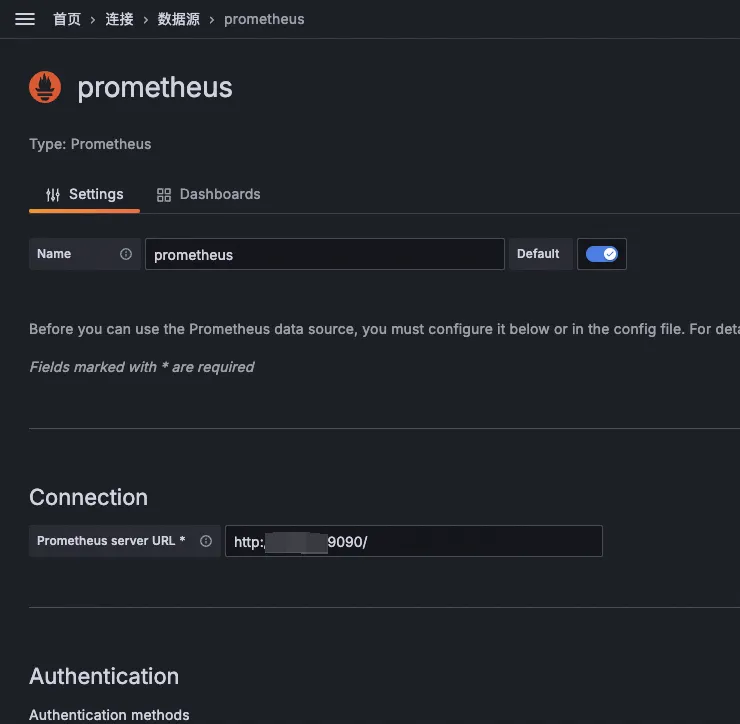
登录后要做的就是将prometheus配置为数据源,
配置也很简单,将prometheus 9090端口的访问地址配置即可
新建看板
grafana看板可以自己创建,
但是也比较麻烦,
不过grafana贴心的推出了看板库,
可以方便的使用,
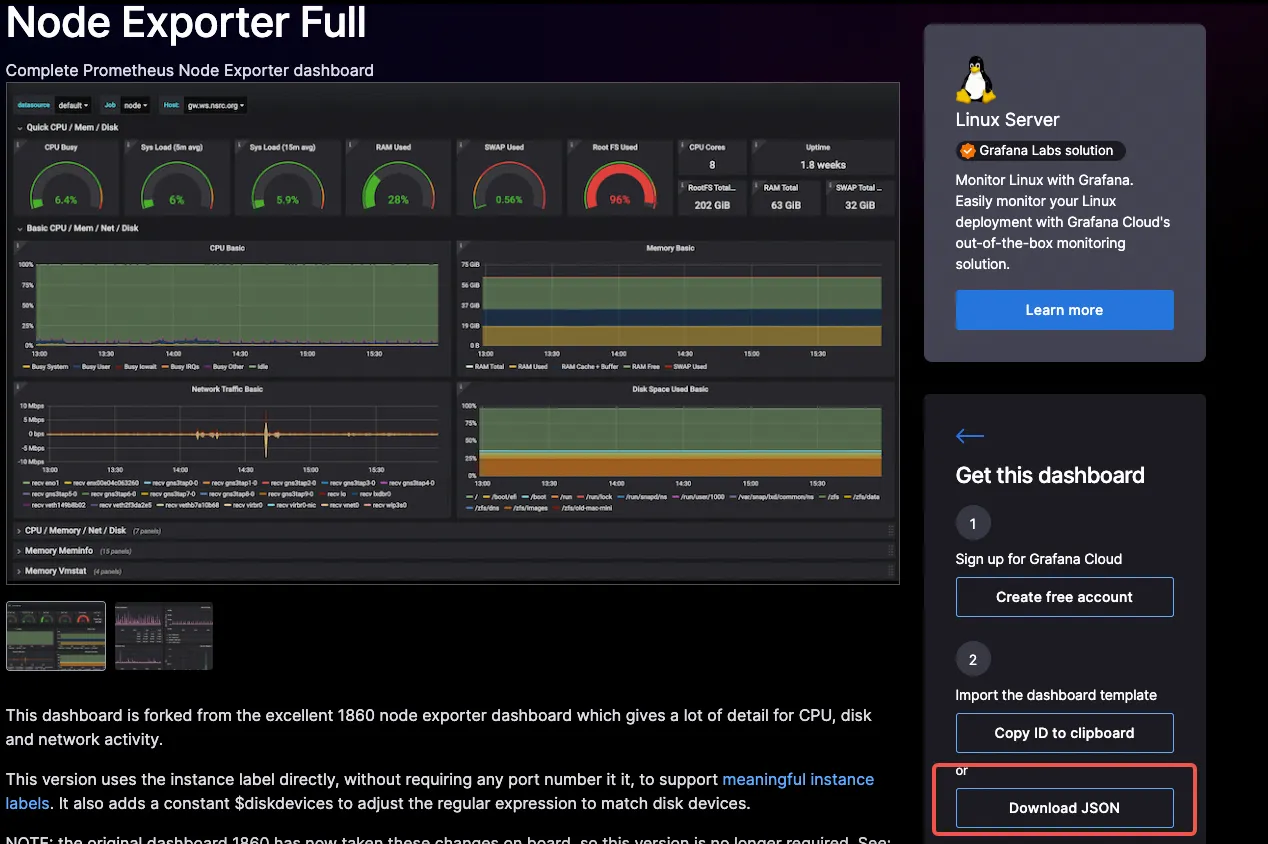
例如服务器监控的node-exporter就有很多看板,
地址: https://grafana.com/grafana/dashboards/?search=prometheus+node+exporter
选择某一个看板后下载json
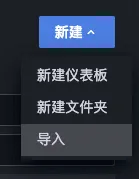
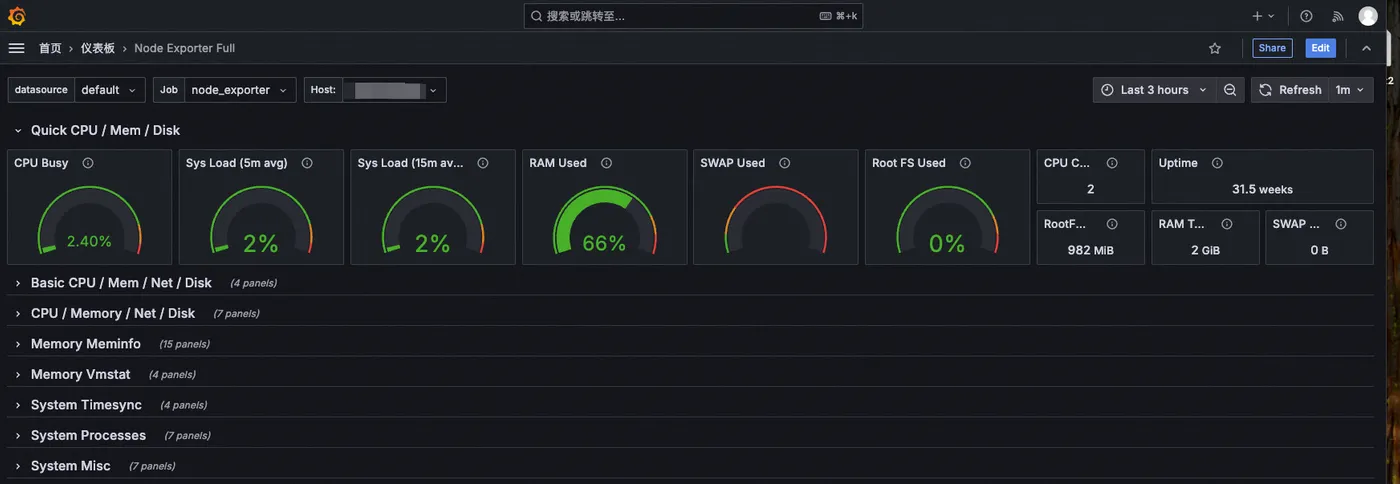
导入看板
然后在自己的grafana中导入这个json,
一个prometheus-server收集梳理数据,
node-exporter上报数据,
grafana可视化的看板就好了,
【总结】
1. 使用docker快速启动prometheus-server端,并通过9090端口访问
2. 使用docker快速启动node-exporter,上报想监听的服务器状态
3. 将node-exporter的地址添加到prometheus.yml配置文件中
4. 使用docker快速启动grafana,并通过3000端口访问
5. 将prometheus的9090可访问地址配置为grafana数据源
6. 在grafana上添加一个prometheus-node-exporter的仪表盘
7. prometheus-server和grafana最好内网可以访问,或者在一台服务器
8. node-exporter的地址可以让prometheus访问到,不管内网还是公网
9. 最终对外的只是grafana